ACMA

ACMA Database Map

The full Australian Communications and Media Authority radiocomms register on a live interactive map. Search every licensed site, inspect frequency, device, and antenna records, buy instant engineering reports as client ready PDFs, analyse point to point microwave links, and build a managed licence portfolio in one workspace.

Free forever on a Standard account. No credit card.

Overview

The Australian Communications and Media Authority (ACMA) maintains the radiocomms register, the authoritative public record of every spectrum licence issued in Australia. The register lists tens of thousands of licensed sites, the frequencies assigned to each, the equipment authorised, the licensees responsible, and the expiry timing of every licence. For an RF engineer planning a new deployment, coordinating against incumbents, validating an interference complaint, or auditing a customer portfolio, the register is the source of truth. The trouble is that the register itself is not designed for engineering use. It is a structured government data source, not a planning surface, and the official tools provide only basic search and download.

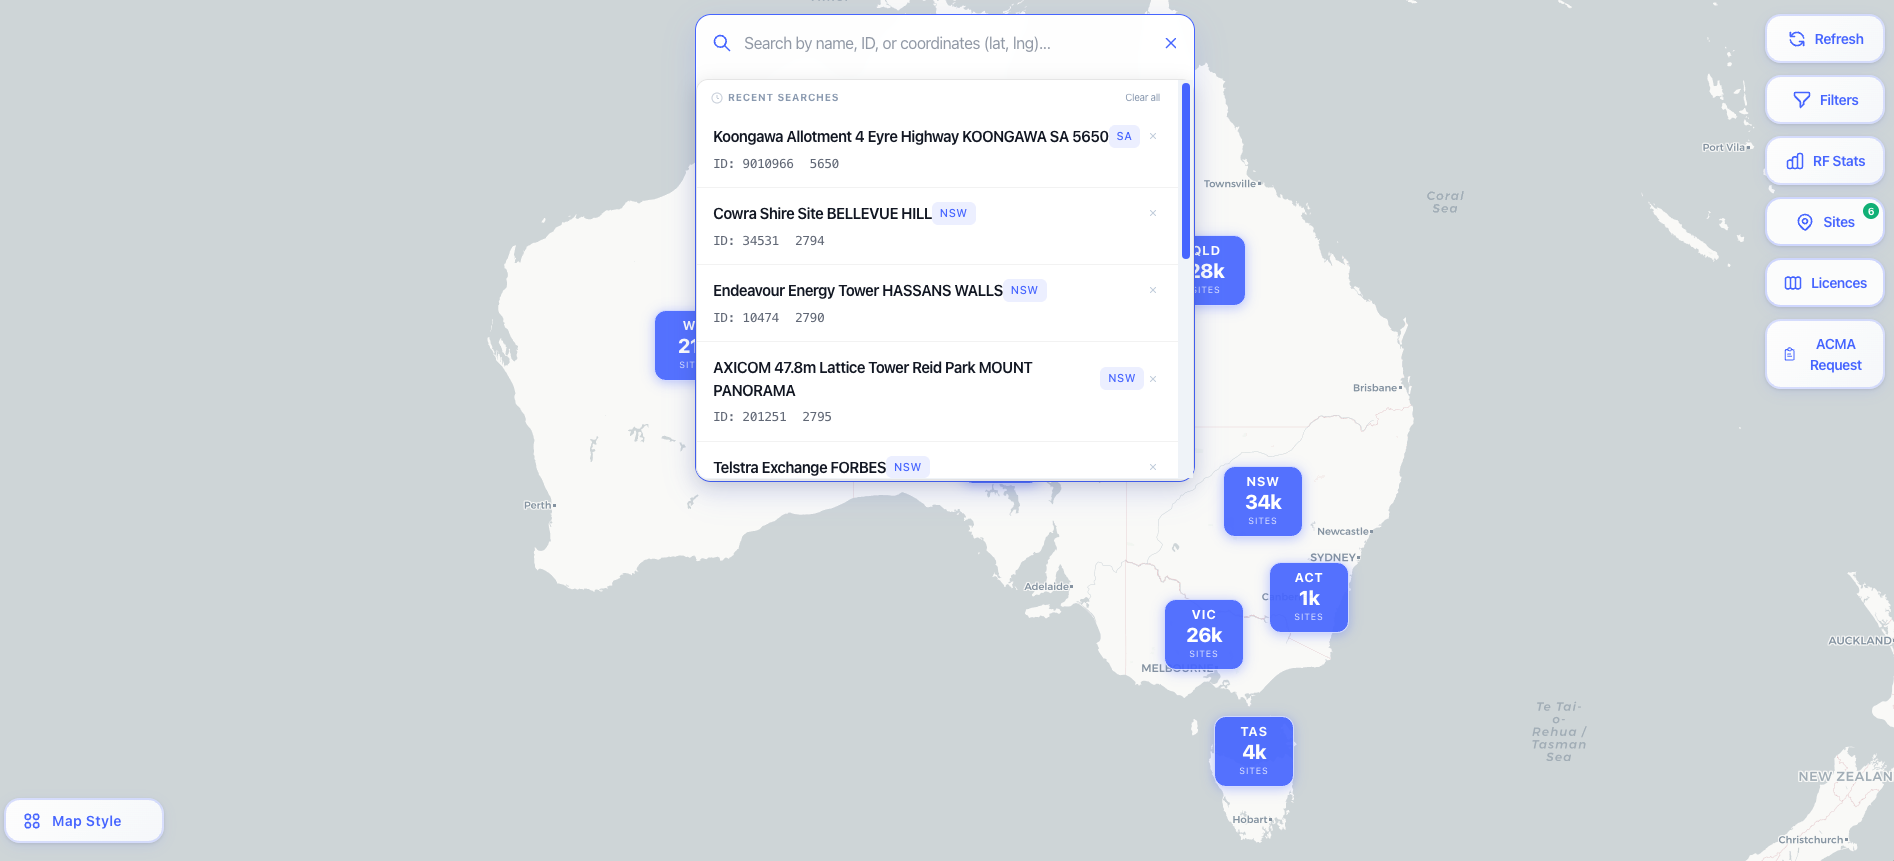
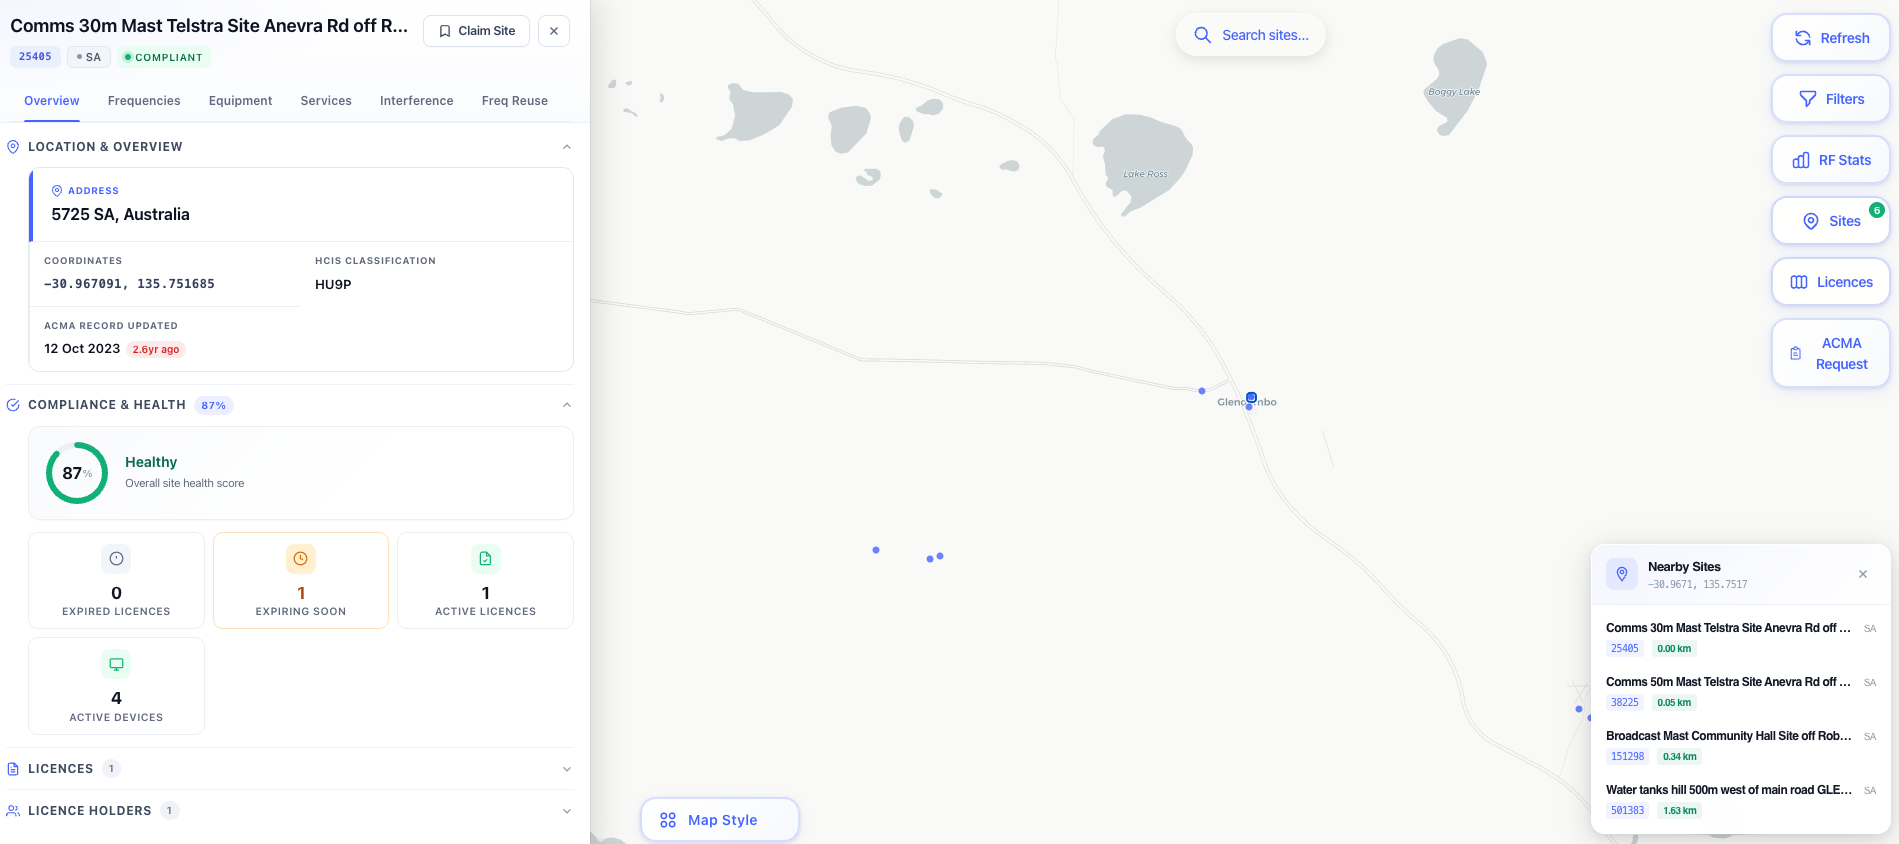
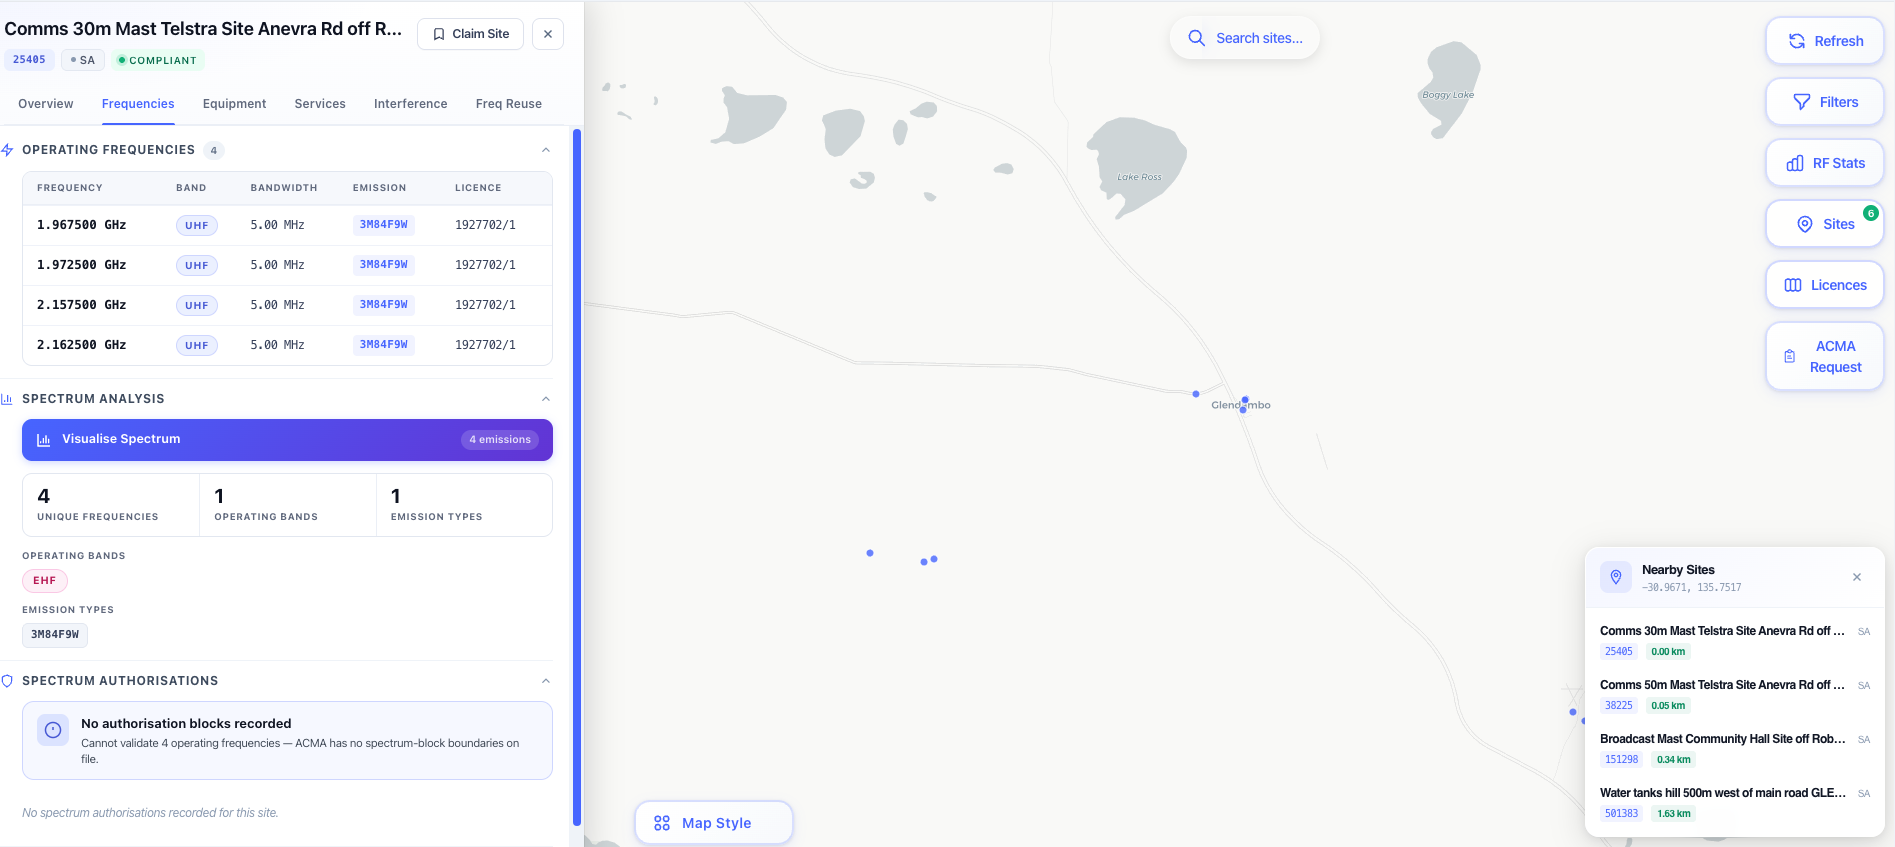
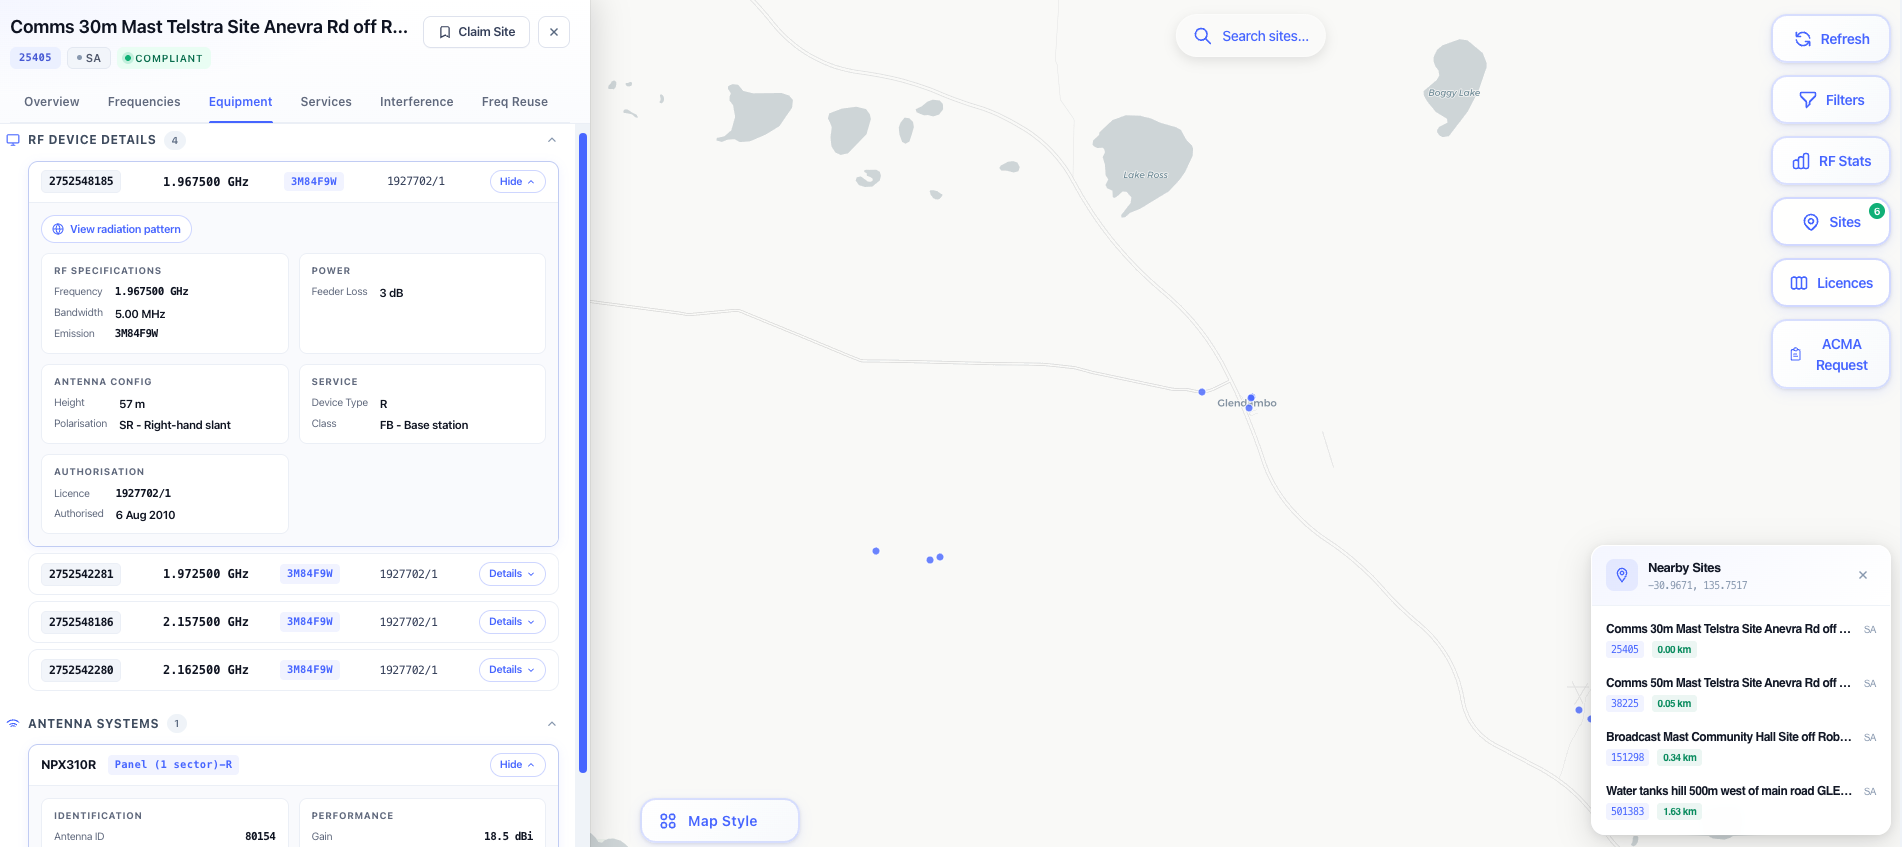
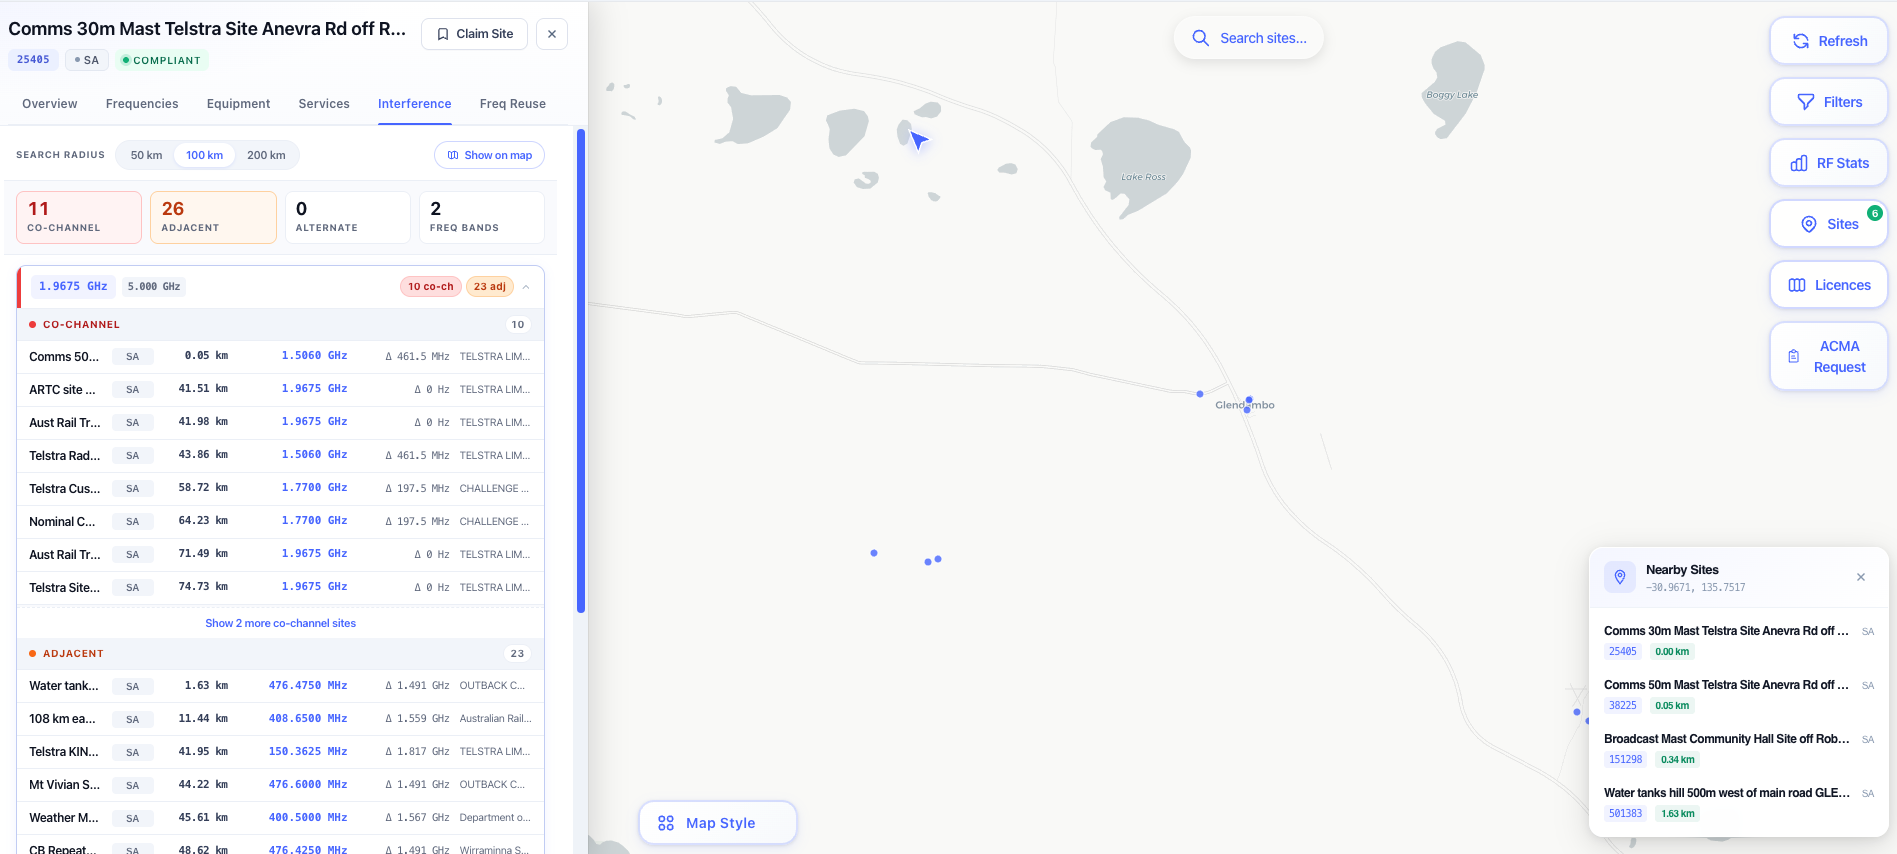
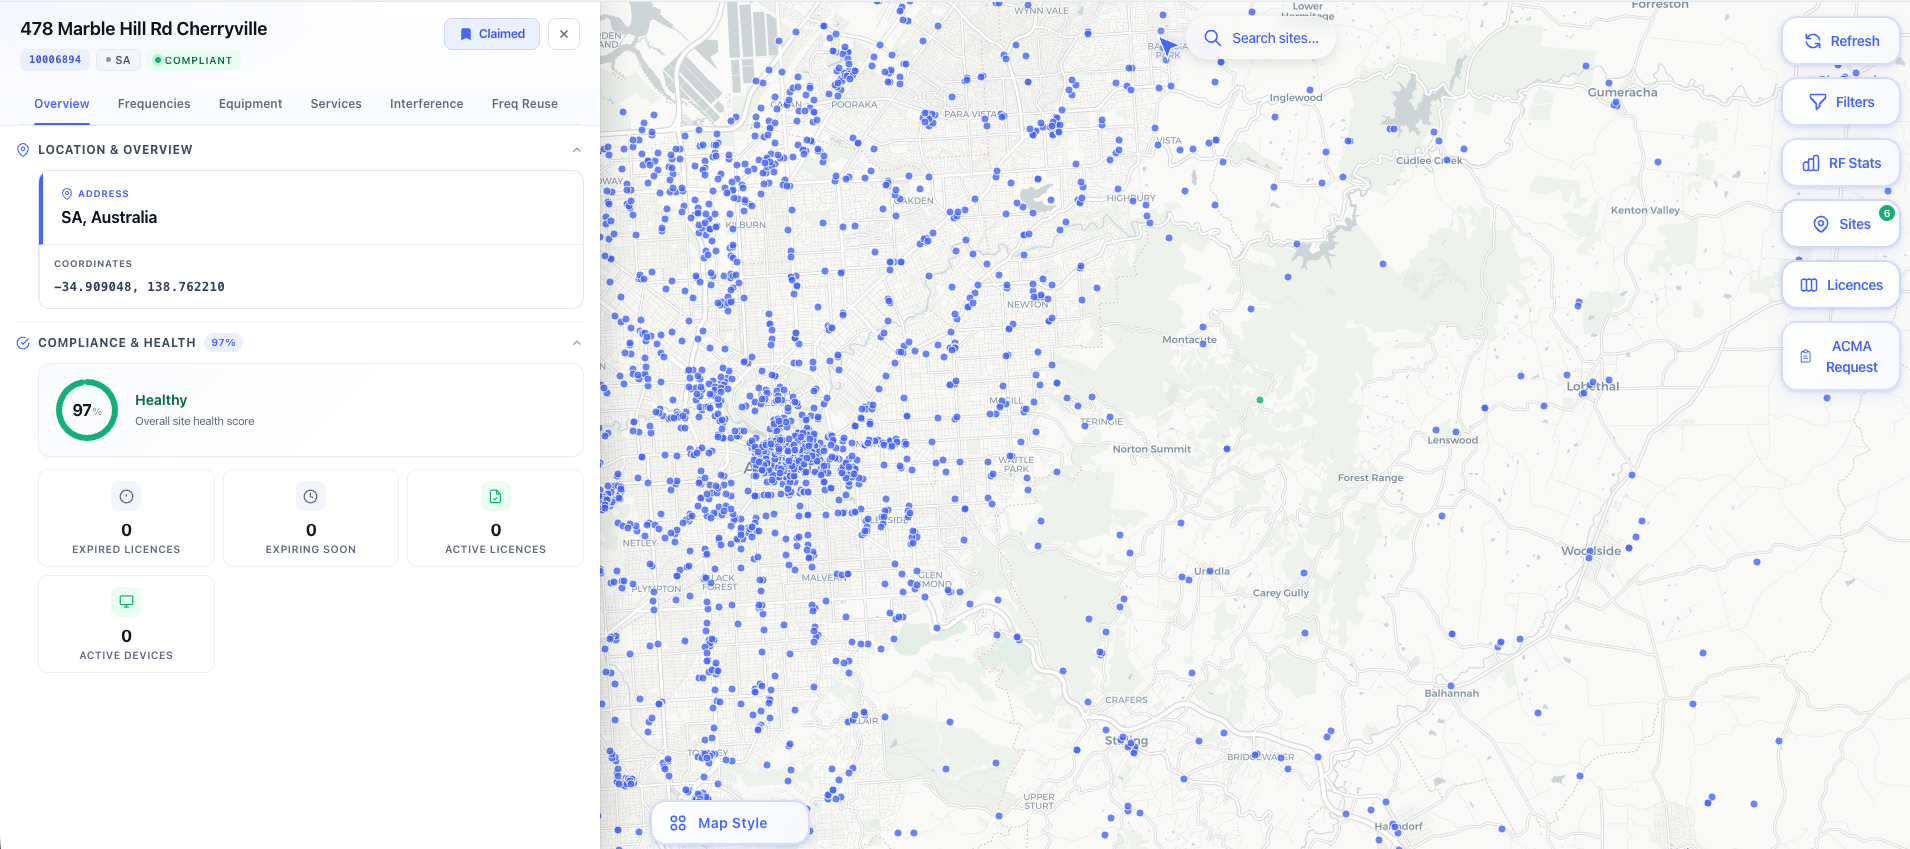
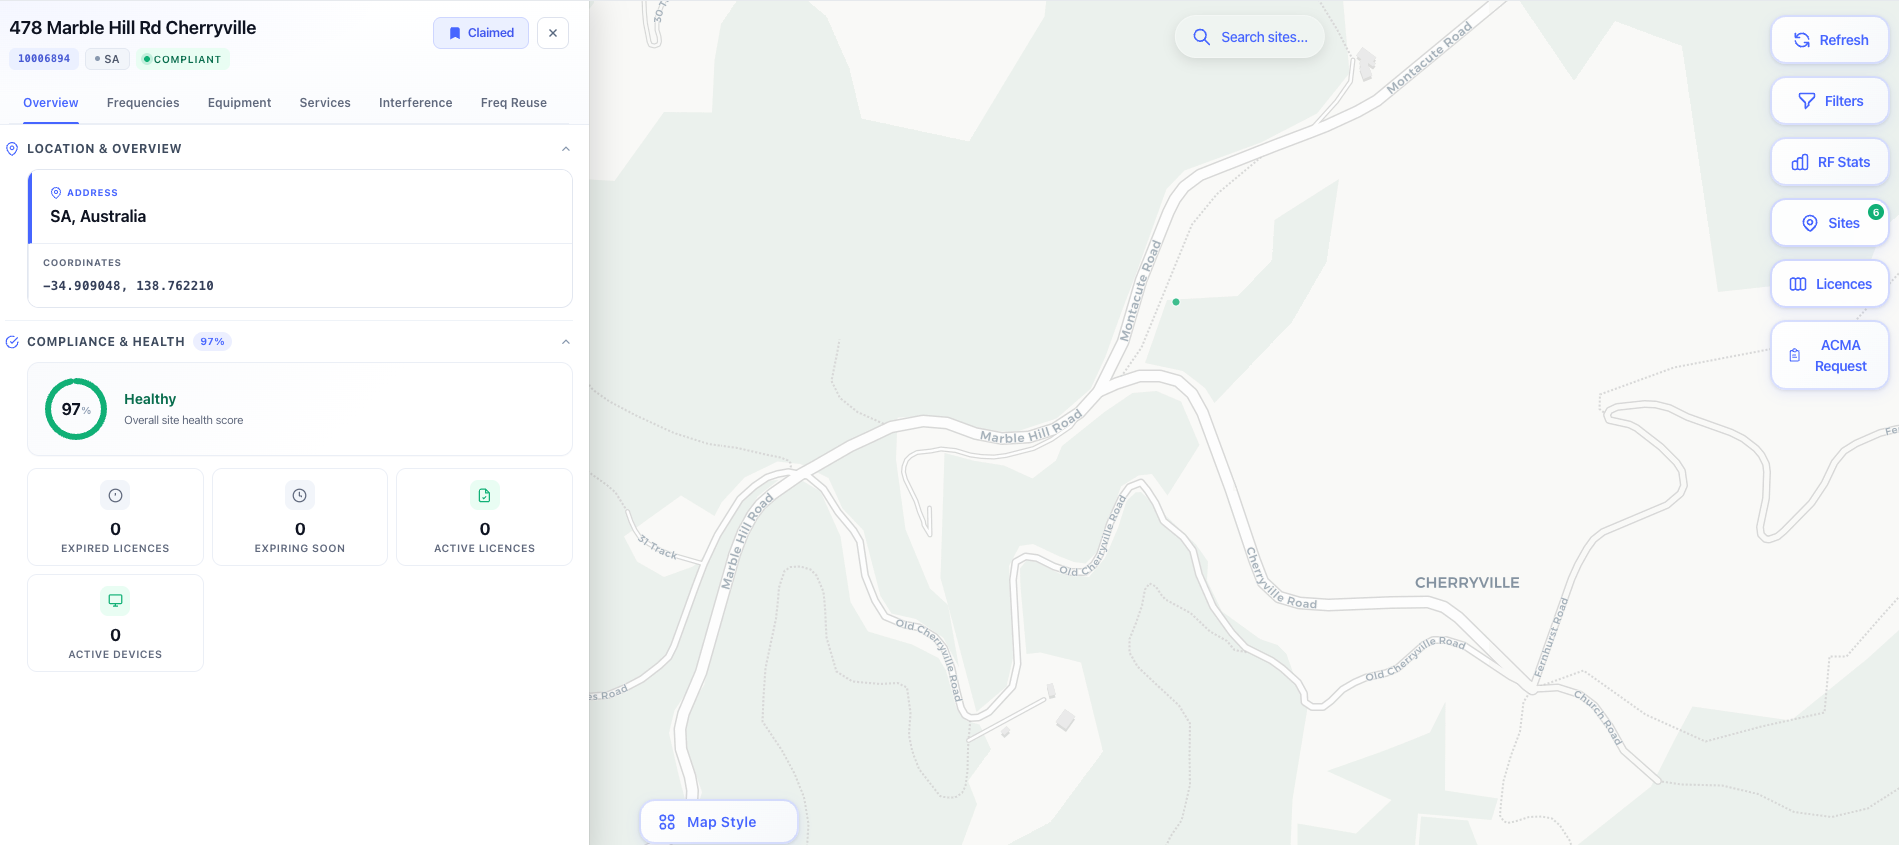
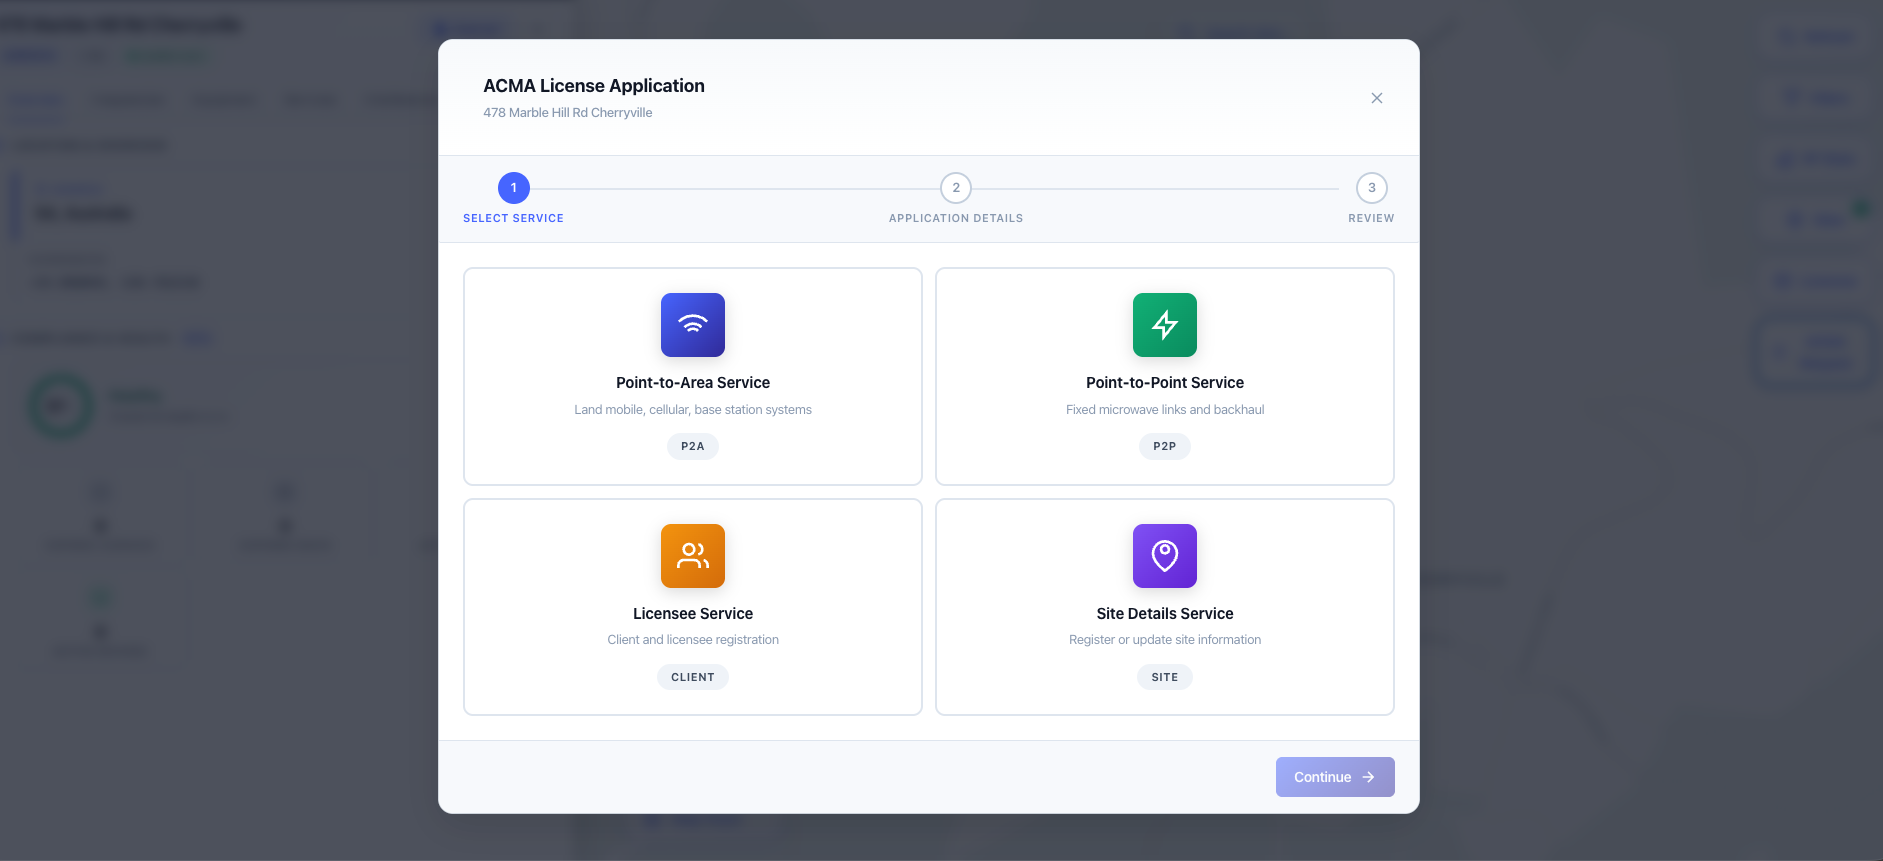
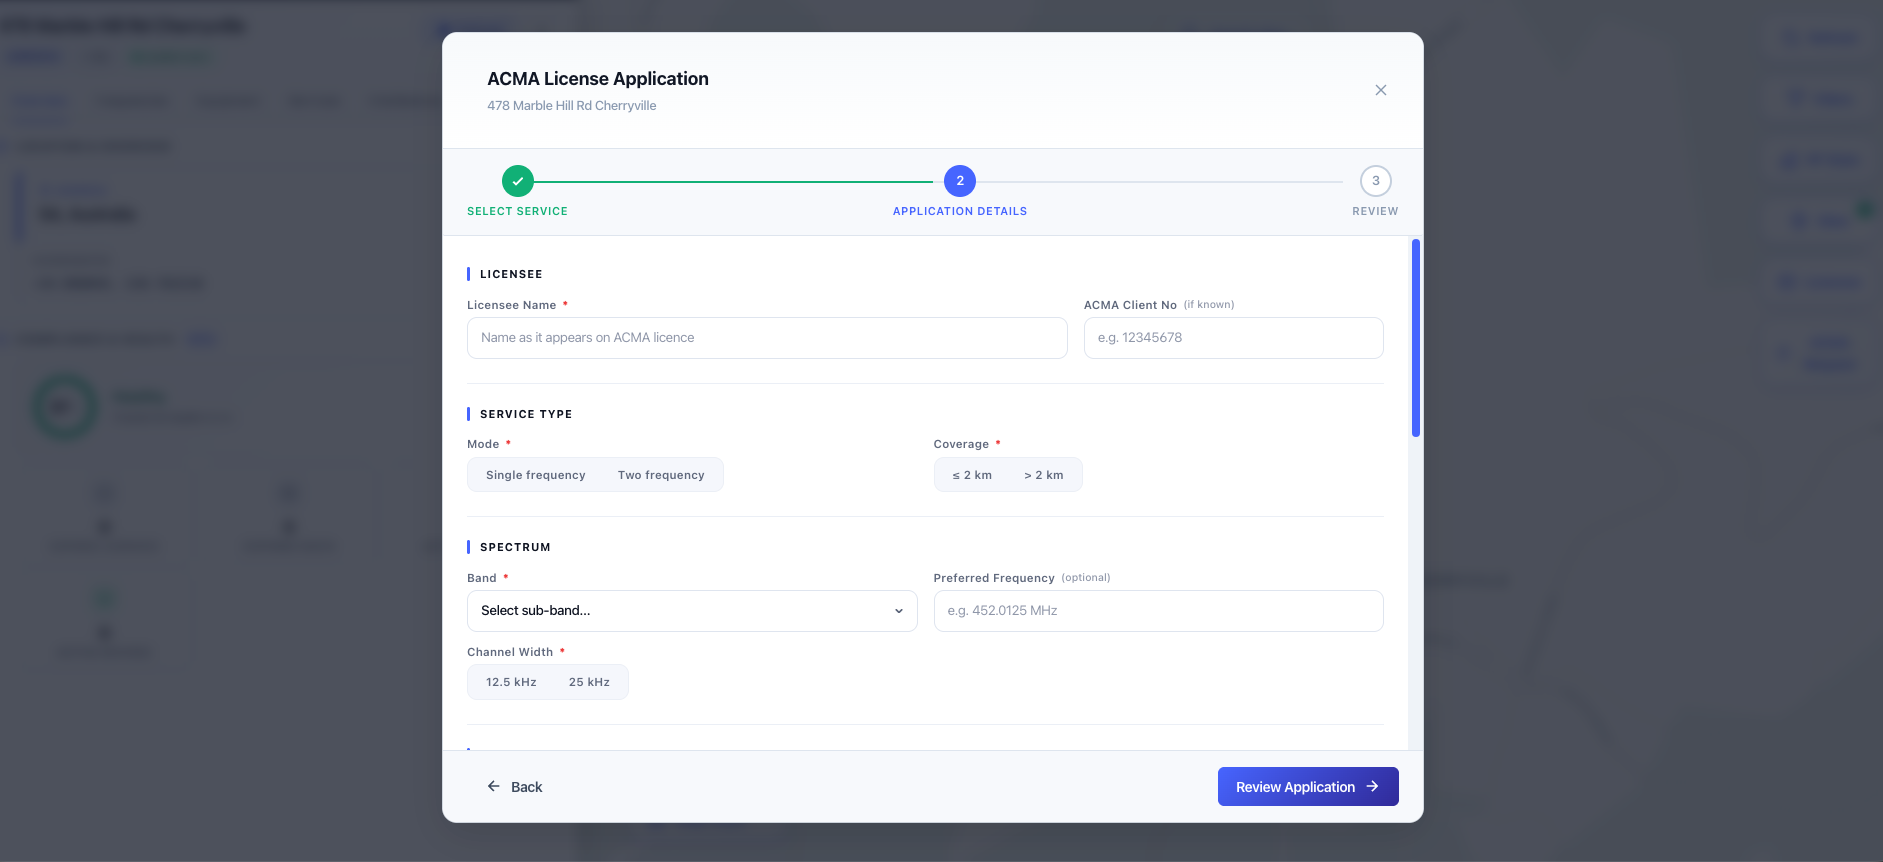
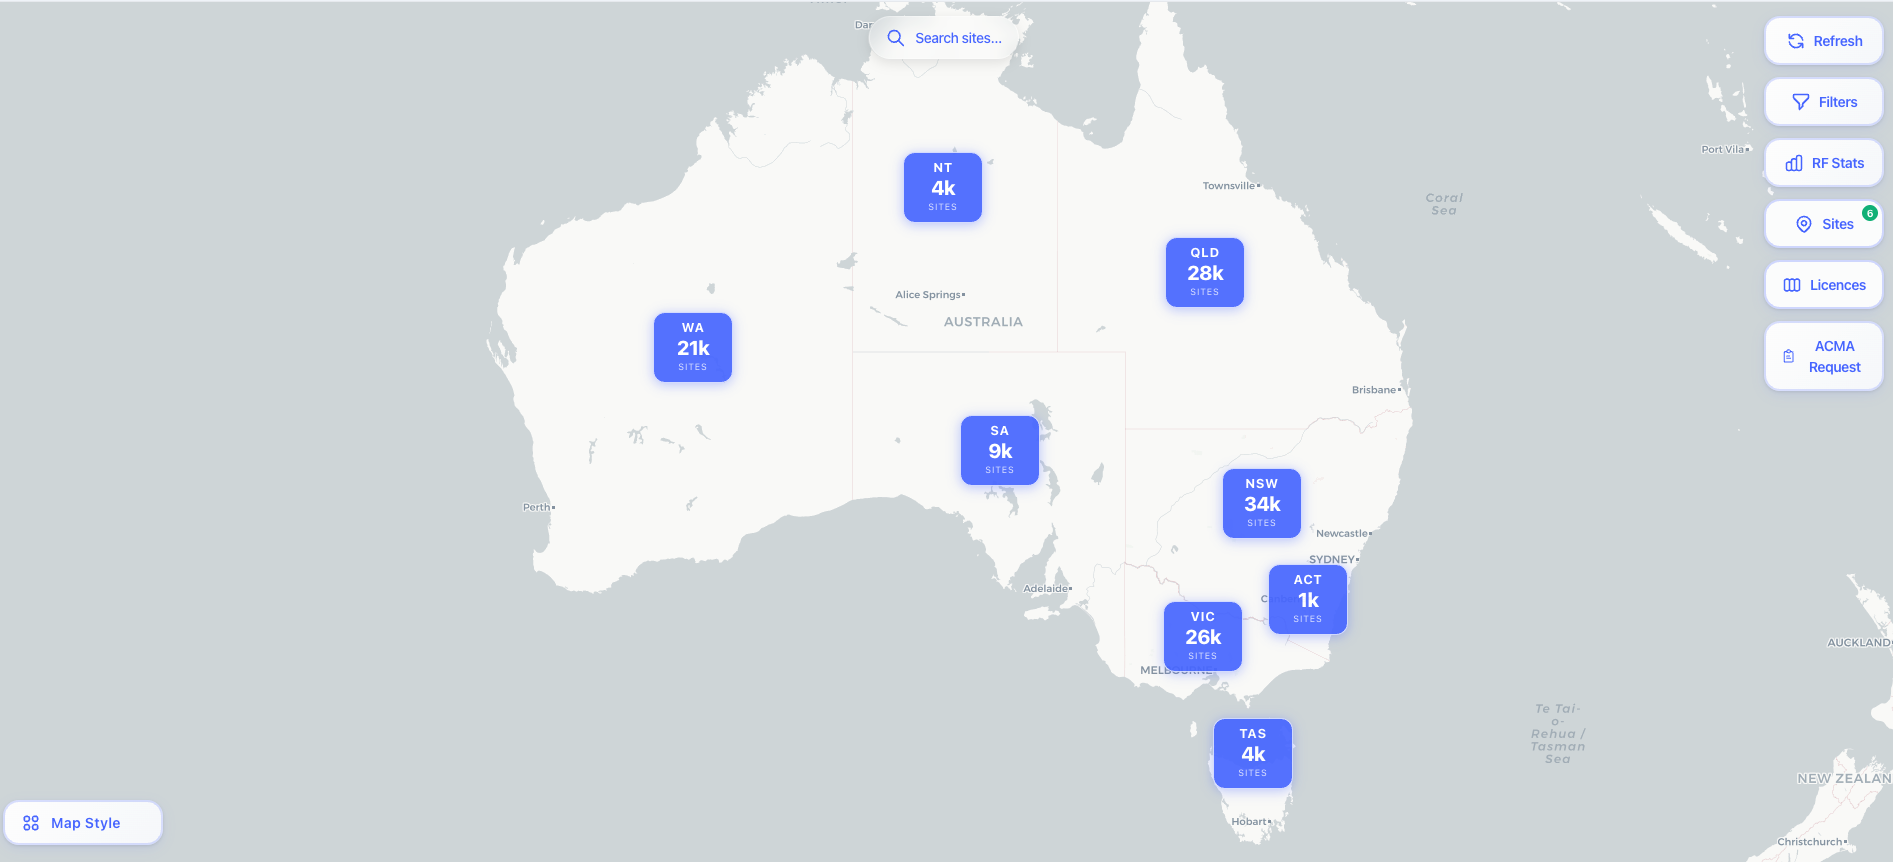
The noIM₃ ACMA Database Map renders the entire register on a live interactive map and turns it into the planning surface engineers actually need. Every licensed site appears as a clustered marker on a Leaflet map with state level population overlays. Pan and zoom resolves clusters into individual licences. Click any site and a multi tab detail panel opens with the full licence record. Overview (licence holder, site name, coordinates, licence class, status, expiry). Frequencies (every assigned TX and RX frequency with emission designator, bandwidth, and power). Equipment (transmitter and receiver make, model and type, and every antenna with height, gain, azimuth, beamwidth, polarisation and tilt). Services (six purchasable reports and the ACMA lodgement forms). Interference (co channel, overlapping and adjacent channel neighbours with antenna discrimination and RALI LM 08 separation). Frequency Reuse (reuse patterns across the licensed band at the site).

Any site can also be turned into a deliverable without leaving the map. Six reports are generated instantly from the register and issued as a noIM₃ branded PDF a client can be sent: a Site Register Audit covering licensing standing, register consistency, coordination exposure and tenancy; a Frequency Analysis covering what is on air, who would be coordinated with, and the worst case level each neighbour could put into the site; a Frequency Assignment Feasibility report answering what could still be put here, reported as contiguous runs of clear channels rather than a list of single frequencies; a Licensing Review with a month by month renewal calendar and the actual condition text attached to every licence; a Co-location & Tenancy report showing who occupies what part of the structure and at what heights; and a Fleet Technology Review splitting analogue from digital by licensee. Reports that cover the structure carry a scaled tower elevation drawing, split across an overview and detail sheets where the structure is crowded. Every report states how much of the site each check could actually evaluate, none is a compliance certificate, and a purchased report is stored against the account with a fingerprint of the register values it used, so reopening it says whether the register has moved and offers a free refresh if it has.

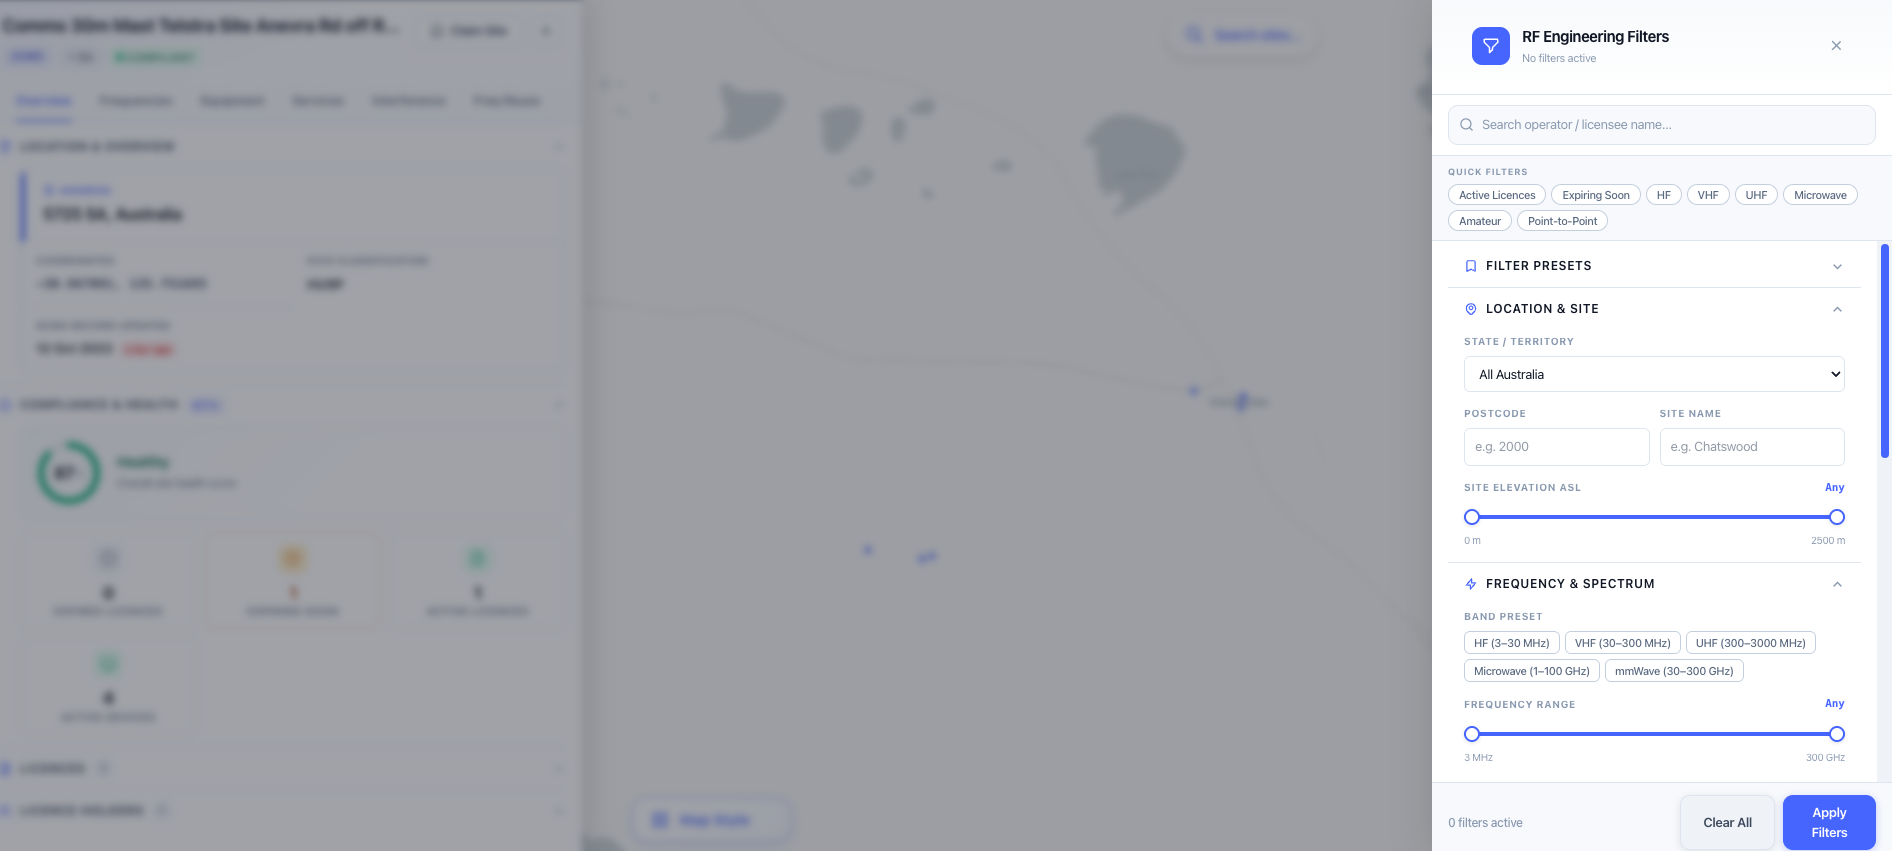
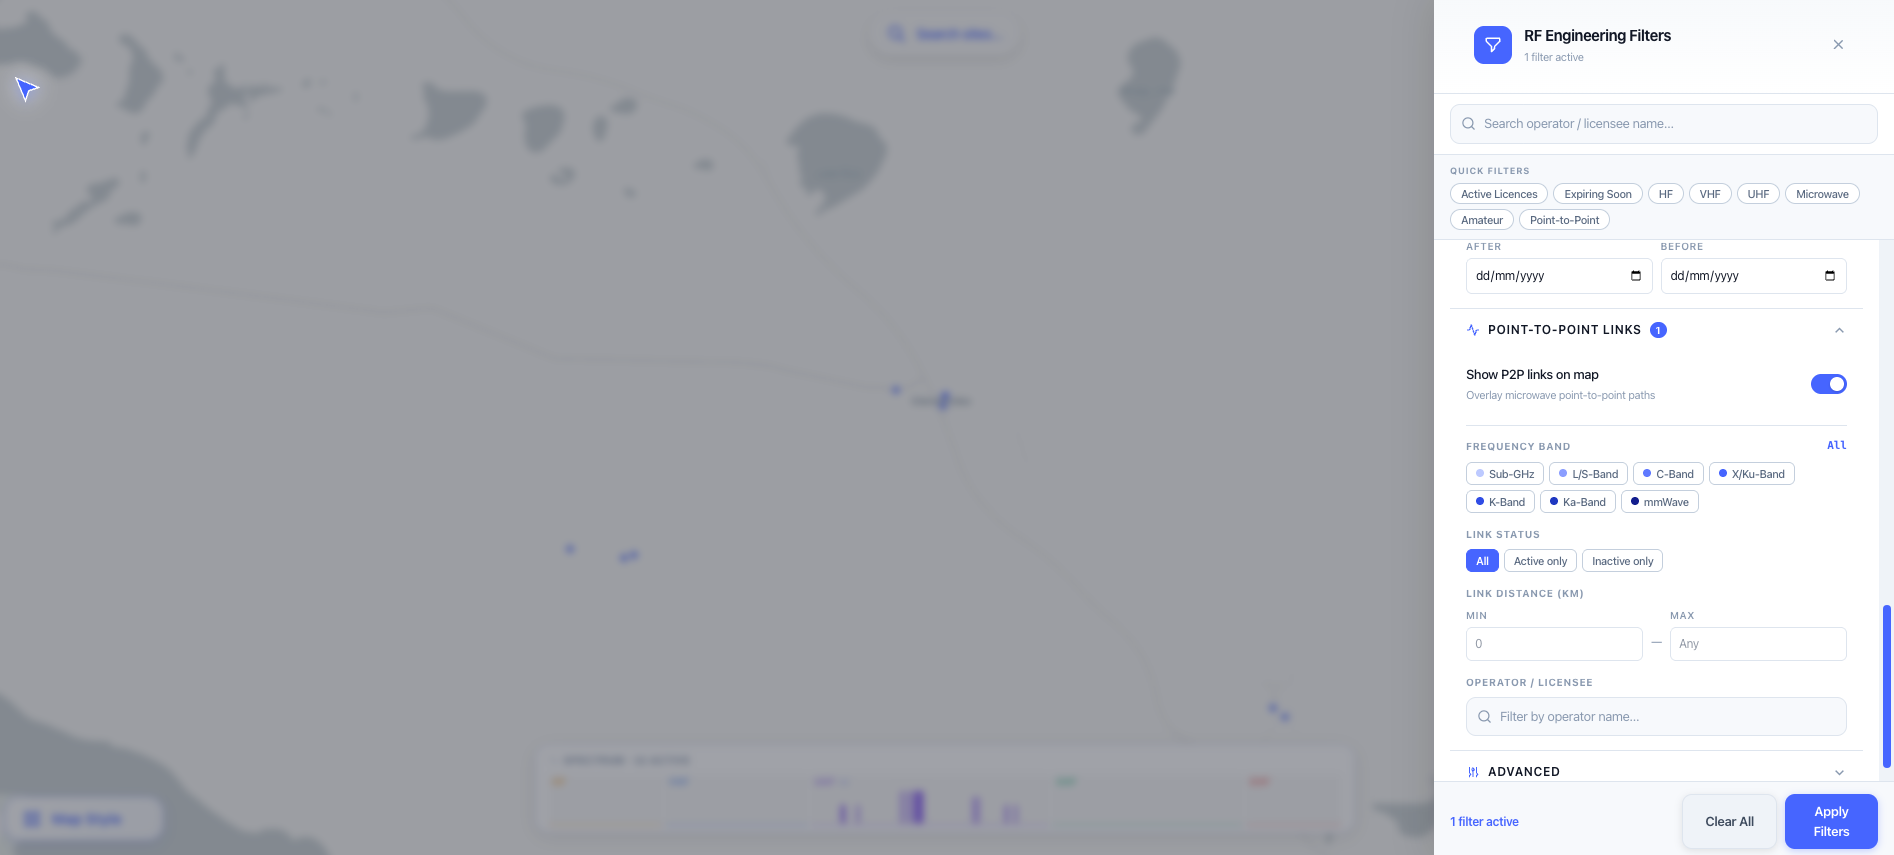
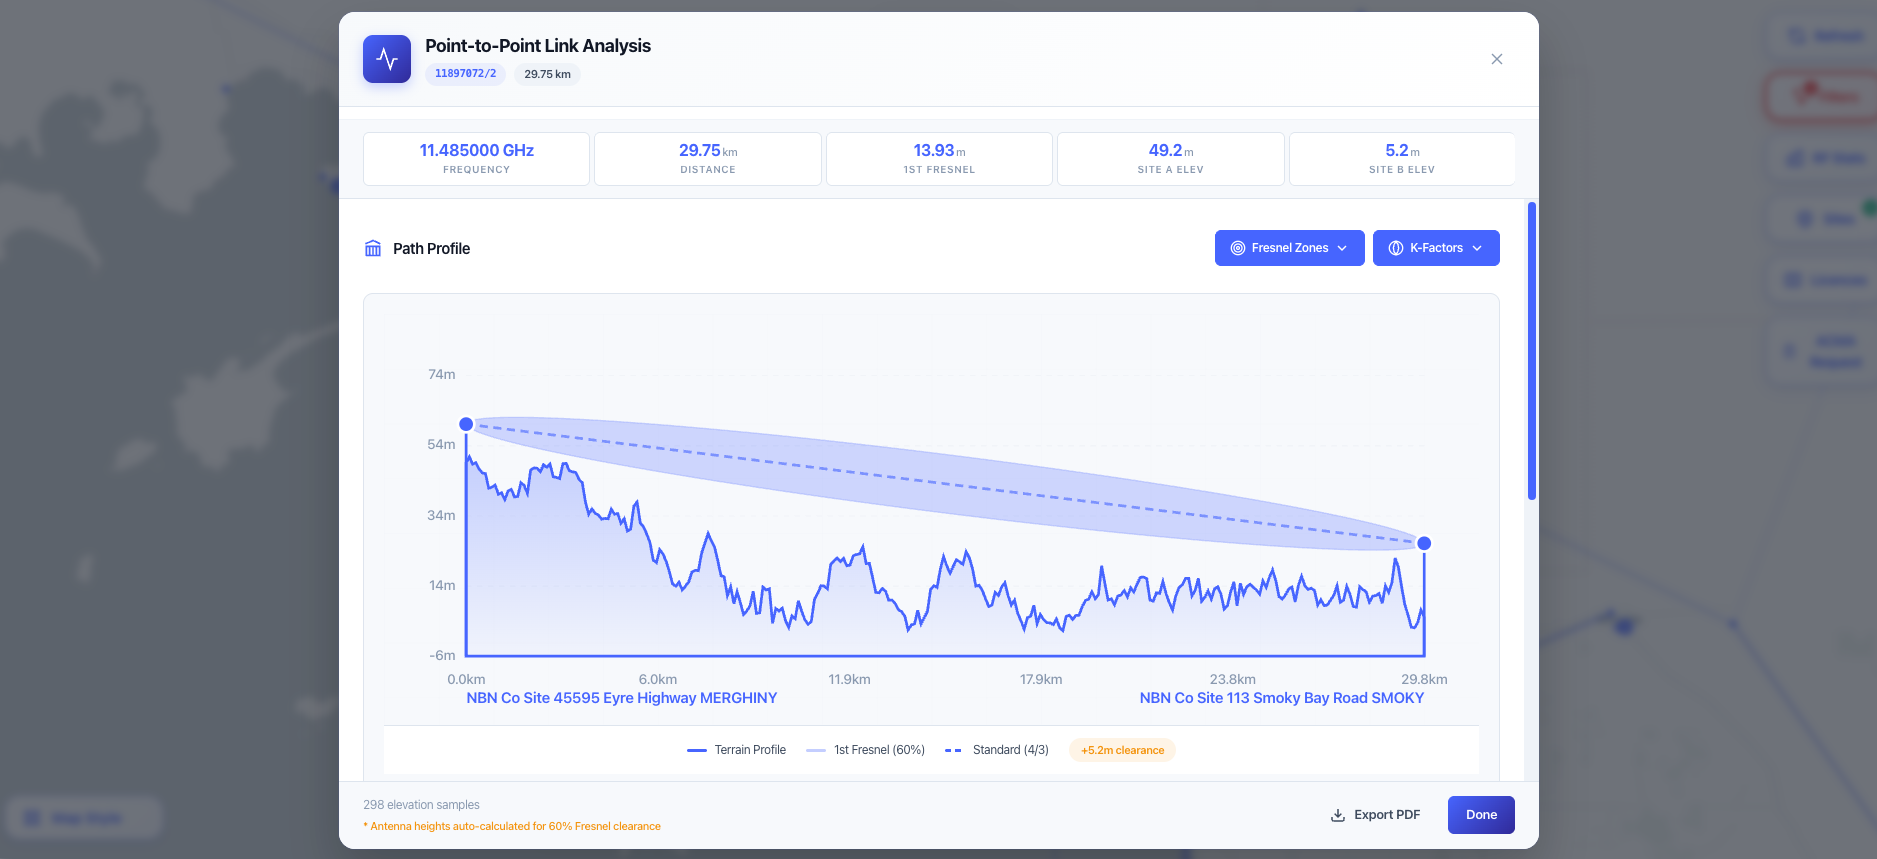
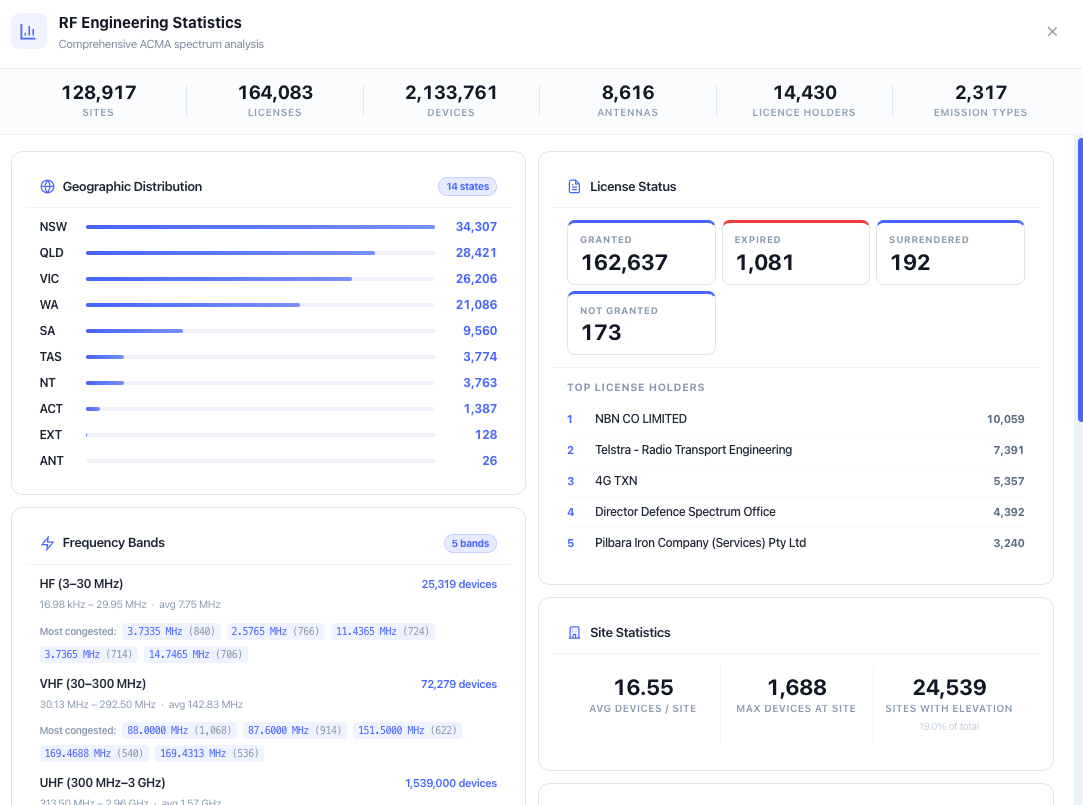
Beyond the per site view, the workspace covers the higher level analyses engineers regularly need. Advanced filtering across 25 plus parameters covering licence status, expiry window (with an expiring soon flag), spectrum band, service type, emission designator, licensee name, and point to point link presence, with all filters persisted in the URL for sharing and navigation. Point to point link analysis identifies co licensed microwave and data links, renders link paths on the map, and surfaces both end site records, assigned frequencies, TX and RX pair details, and separation distance. The portfolio system lets authenticated users claim sites and build a managed licence portfolio with expiry alerts and aggregated dashboards. The spectrum band plan overlay places any frequency in the band plan context. The RF statistics panel aggregates frequency distribution, licensee counts, service type breakdown, and expiry forecasts across the visible map area.

Capabilities

Live ACMA register map

The entire ACMA radiocomms register is rendered on a Leaflet 1.9.4 map with Markercluster grouping and state level count bubbles. As you zoom in, clusters resolve to individual licensed sites. Each marker represents a physical licensed location with access to the full licence record. The map updates on pan and zoom, and all filter, search, and portfolio state is preserved in the URL so any view is shareable and bookmarkable directly.

Six tab site detail panel

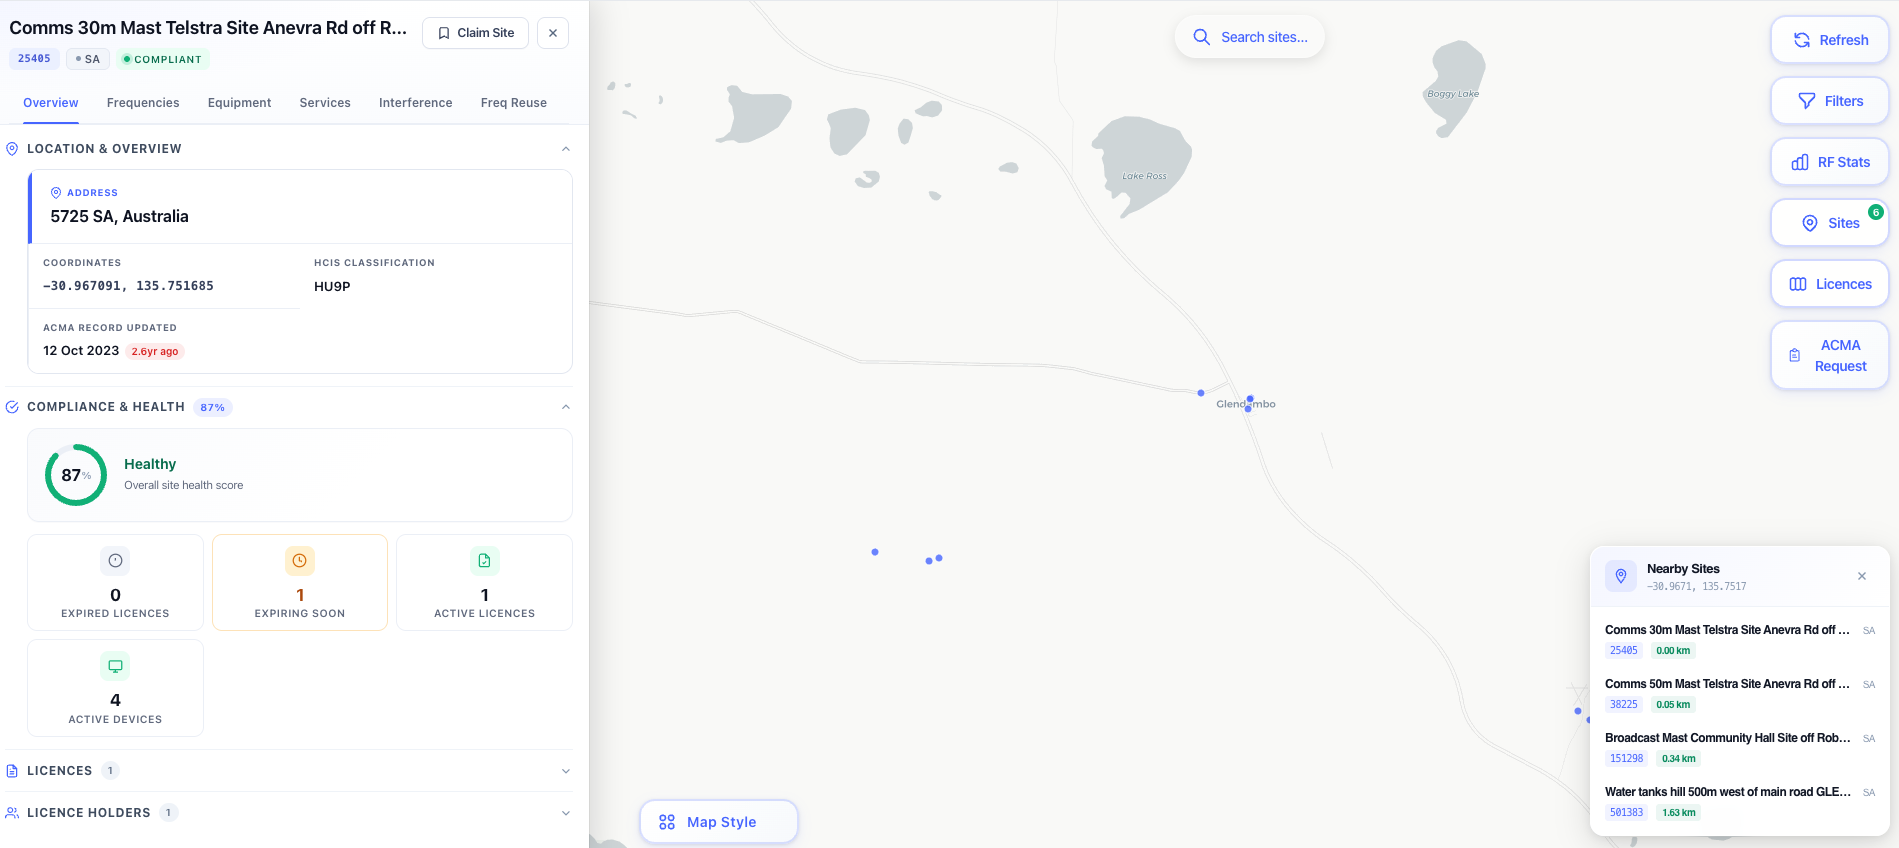
Clicking any site opens a comprehensive detail modal with six tabs. Overview (licence holder, site name, coordinates, licence class, status, expiry). Frequencies (every assigned TX and RX frequency with emission designator, bandwidth, and power). Equipment (transmitter and receiver make, model and type, and every antenna with height, gain, azimuth, beamwidth, polarisation and tilt). Services (the six purchasable reports and the ACMA lodgement forms). Interference (co channel, overlapping and adjacent channel neighbours with antenna discrimination and RALI LM 08 separation). Frequency Reuse (reuse patterns across the licensed band at the site).

Six instant engineering reports

Turn any site into a client ready PDF without leaving the map. Site Register Audit (licensing standing, register consistency, coordination exposure, tenancy). Frequency Analysis (what is on air, who to coordinate with, and how hard each neighbour lands). Frequency Assignment Feasibility (what could still be put here, as contiguous runs of clear channels). Licensing Review (renewal calendar and the condition text attached to every licence). Co-location & Tenancy (who occupies what part of the structure, and at what heights). Fleet Technology Review (analogue against digital by licensee, and how long each authorisation has stood). Each is priced separately, charged once, and reopened at no extra cost.

Reports that state what they cannot evidence

Every report is sourced entirely from the register and says so on its face. None is a compliance certificate, and a finding is a matter to check rather than a determination of non compliance. Every finding states how many devices or licences the check could actually evaluate, so a check that found nothing and a check that could not run are never presented the same way. Where a received level is computed it uses free space, the least loss any real path can have, so it can clear a pair but never condemn one.

Change detection on a purchased report

A generated report is stored against your account with a fingerprint of every register value it was computed from. Reopening it compares that fingerprint against the register as it stands: if nothing has moved the stored report opens straight away, and if the site record has changed the panel says so and the refresh costs nothing. A report already sent to a client does not change silently underneath them.

Structure elevation drawings

Reports covering the structure carry a scaled elevation of the tower drawn from the register: every registered mount at its height, drawn as its antenna class, with the vertical gap between adjacent mounts dimensioned and each position labelled with height, azimuth, gain and bands. A crowded structure is split across an overview sheet and a detail sheet per level, so a 176 metre mast carrying 45 mounts stays readable.

Channel finder

Sweep a band and duplex split across the channel raster around a point and see what the register contains on every channel and on the channels either side, with candidate pairs ranked worst case first across both legs. The band and split presets are measured from where assignments actually cluster in the register rather than assumed. It reports what the register holds within a stated radius and never claims a channel is available, because what can be licensed depends on the band plan, service class and embargoes the register does not carry.

Advanced filtering with 25 plus parameters

Filters cover licence status, expiry window (including an expiring soon flag), spectrum band, service type, emission designator, licensee name, point to point link presence, and custom band selections for P2P analysis. Boolean filters toggle directly from the map toolbar. All active filters are written to the URL query string, so filtered views are fully shareable and survive page reload without re entry.

Point to point microwave link analysis

The P2P module identifies co licensed point to point microwave and data links from the register, renders link paths on the map, and opens a dedicated P2P analysis panel for any selected link. The panel surfaces both end site records, assigned frequencies, TX and RX pair details, and separation distance. Filtering by P2P band lets engineers focus on specific microwave allocations (6 GHz, 11 GHz, 18 GHz, 23 GHz, 26 GHz, and others) across the visible map area.

Portfolio and claimed sites

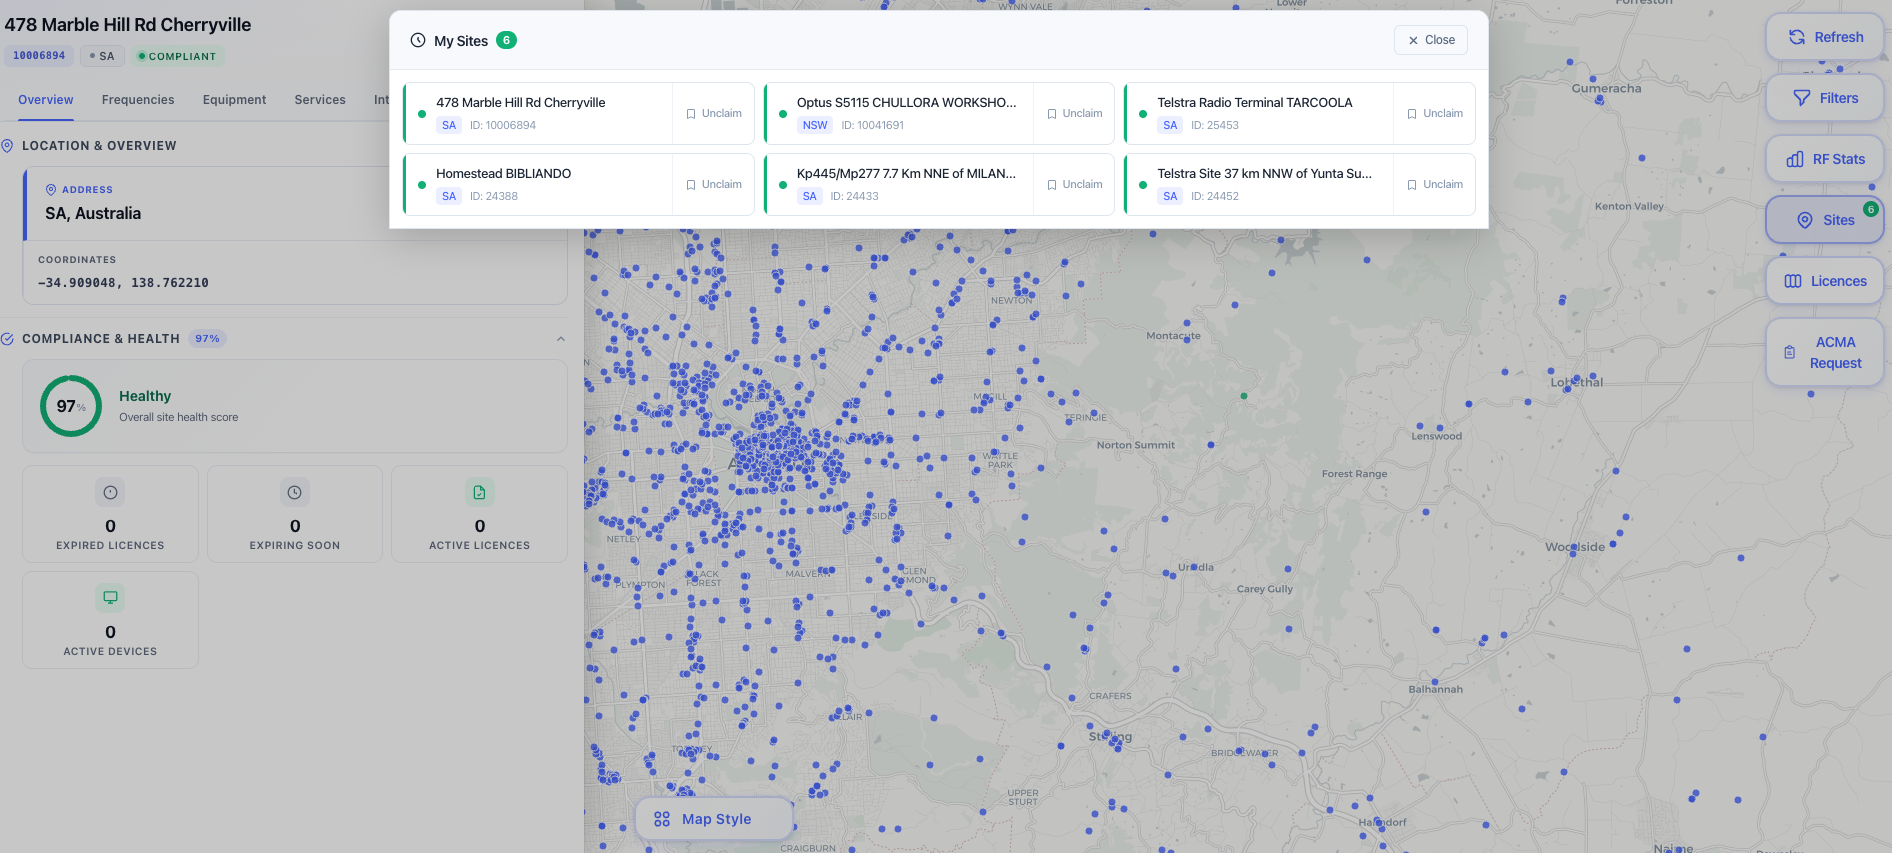
Authenticated users can claim any site in the register to build a managed licence portfolio. The portfolio dashboard provides an aggregated view of claimed sites with status, expiry alerts, and quick access to individual records. The claimed sites panel plots owned licences on the map for spatial portfolio review. Useful for licence holders, consulting engineers managing client sites, and operators tracking expiry dates across a national fleet.

RF statistics panel

Aggregates frequency distribution, licensee counts, service type breakdown, and expiry forecasts across the current map view or the full register. Useful for understanding licence density at a candidate location, identifying the dominant licensee in an area before a coordination engagement, and forecasting renewal workload across a portfolio.

Spectrum band plan overlay

Live frequency band plan overlay aligned to the current map view. Place any selected frequency in the ACMA band plan context (allocation, service type, primary versus secondary, footnotes) without leaving the map. Useful when validating that a candidate frequency falls inside the right allocation, or when reviewing licensed activity in a specific band.

Search and discovery

Coordinate based search to find every licensed site within a configurable radius of a point of interest. Site name and licensee text search with a recent search history. Nearby site discovery from any selected marker. Useful for early site survey, interference investigation, and licence application preparation where the question is what is already licensed near my proposed location.

Filter and view persistence

Every filter, search, and view state is serialised into the URL query string. A filtered view (for example all 6 GHz P2P links expiring within 12 months in a particular state) can be shared with a colleague by copy and paste of the URL. Bookmarks survive reload. Distinct workspaces can be maintained for different clients or projects without overwriting state.

Standards & methodology

  • ACMA Radiocomms Licence Register data
  • ACMA Australian Radiofrequency Spectrum Plan
  • ACMA RALI (Radiocommunications Assignment and Licensing Instructions) for fixed services
  • ITU R radio regulations referenced by ACMA band allocations
  • ACMA RALI LM 08 Table C3.2 co channel separation for land mobile
  • ITU R F.1245 and F.699 antenna radiation pattern discrimination
  • ITU Radio Regulations Appendix 1 emission designators

When to use this tool

  • Searching the ACMA register for licensed sites, licensees, and assigned frequencies
  • Reviewing the full licence record for a site before planning a new deployment
  • Identifying co channel or adjacent channel neighbours for interference assessment
  • Mapping point to point microwave link networks and analysing paired site records
  • Filtering expiring licences to prioritise renewal or coordination tasks
  • Building and managing a portfolio of licensed sites for a client or organisation
  • Overlaying the spectrum band plan to understand allocation context at any frequency
  • Issuing a client ready site register audit or frequency analysis as a branded PDF
  • Testing whether a band has contiguous room at a site before lodging an application
  • Building a renewal calendar and pulling the condition text attached to every licence
  • Reconciling a tower rent roll against what the register shows each tenant occupying
  • Identifying which operator at a site still runs analogue when building an upgrade proposal
  • Using coordinate search to identify all licensed sites near a proposed location
  • Generating RF statistics and licence distribution reports for a geographic area
  • Supporting ACMA licence applications with spatial and interference data
  • Auditing an inherited licence portfolio against current register state
  • Investigating interference complaints by mapping incumbent licences along a candidate path

Is this the right tool for you?

Reach for the ACMA Database Map in any of the following situations.

  • You are planning a new microwave or fixed wireless deployment in Australia and need to see every licensed site near your candidate location before submitting an ACMA application.
  • You are responding to an interference complaint and need to identify which licensed transmitters are near the affected receiver and what frequencies they hold.
  • You are coordinating a new microwave point to point link and need to identify existing P2P licences along the path that could create co channel or adjacent channel issues.
  • You are managing a national radio site portfolio for a mining, utilities, or government client and need a single workspace that tracks every claimed licence with expiry alerts.
  • You are reviewing a vendor proposed deployment and need to confirm which existing licences sit on the same frequency in the same area.
  • You are forecasting renewal workload across a licensed fleet and need an aggregated expiry view ready for the next twelve, twenty four, or thirty six months.
  • You are conducting due diligence on an acquisition that includes a radio licence portfolio and need a fast structured review of every licence in the portfolio against the live register.
  • You are validating that a candidate operating frequency falls within the correct ACMA band allocation by overlaying the spectrum band plan against the working map view.
  • You are preparing an engineering submission for an ACMA licence application and need spatial and interference data to support the proposed frequency and antenna configuration.
  • You are searching the register for a particular licensee (for example to confirm what licences a competitor or partner holds in a region) and need a fast text search with a recent history.
  • You are evaluating whether to take on a new client whose site is in a heavily licensed area and need licensee count and service breakdown for the area before pricing the engagement.
  • You are sharing a filtered view (for example all 6 GHz P2P licences in WA expiring within 12 months) with a colleague and need a URL that survives reload and email forwarding.
  • You are training new RF engineers in ACMA register usage and want a teaching workspace that exposes filter parameters, P2P link analysis, and band plan overlay together.
  • You are diagnosing why a new transmitter is creating interference complaints from a particular existing licensee and need to see the full record of the affected site.
  • You are responsible for a national operator radio fleet and need an at a glance view of which licences expire in the next quarter so renewal applications can be prioritised.

Frequently asked questions

Where does the data come from?

The Australian Communications and Media Authority (ACMA) Radiocomms Licence Register, which is the authoritative public record of every spectrum licence issued in Australia. The map renders the register data live, and updates as the underlying register is updated. Every site, frequency, device, antenna, and service order shown on the map traces back to the ACMA register record.

What licence classes are covered?

All Australian spectrum licence classes covered by the register. Apparatus licences (the dominant class for fixed and mobile RF deployments). Class licences. Spectrum licences. The site detail panel surfaces the licence class explicitly, and filtering by licence class is supported alongside service type, band, and licensee filters.

How does the point to point link analysis work?

The P2P module identifies co licensed point to point microwave and data links by analysing the register relationship between paired licensed sites. Identified links are rendered as link paths on the map with both end site records accessible from a dedicated P2P analysis panel. Filtering by P2P band lets engineers focus on specific microwave allocations (6 GHz, 11 GHz, 18 GHz, 23 GHz, 26 GHz, and others). Useful for coordination work, interference investigation, and competitive intelligence on existing microwave networks.

Can I claim and track sites in a portfolio?

Yes. Authenticated users can claim any site in the register to build a managed licence portfolio. The portfolio dashboard provides an aggregated view of claimed sites with status, expiry alerts, and quick access to individual records. The claimed sites map panel plots owned licences spatially. Useful for licence holders managing their own fleet, consulting engineers managing client sites, and operators tracking expiry across a national portfolio.

How does filter persistence work?

All filter, search, and view state is serialised into the URL query string. A filtered view can be shared with a colleague by copy and paste of the URL, bookmarked for later return, or kept open in distinct browser tabs for different clients or projects. The URL is the single source of truth for the workspace state, so reloads do not lose context.

What kind of interference analysis is included?

The Interference tab on the site detail panel surfaces co channel and adjacent channel neighbours with separation distance and a risk indicator. Useful for fast first pass interference assessment when planning a new deployment near an existing licensed site, or when investigating an interference complaint against a working network.

What are the site reports and what do they cost?

Six reports can be generated against any site, each aimed at a different question rather than one report sold six times: Site Register Audit, Frequency Analysis, Frequency Assignment Feasibility, Licensing Review, Co-location & Tenancy, and Fleet Technology Review. Each is built instantly from the register and issued as a noIM3 branded PDF with a CSV of the findings. They are priced in credits by the size of the site, or for the channel search by how congested the surrounding area is, so a two device site costs a fraction of a shared broadcast mast. A report is charged once and can be reopened at no extra cost.

Are the reports a compliance certificate?

No, and every report says so on its face. They are sourced entirely from the ACMA register, which records what is licensed rather than what is installed or radiating. A finding is a matter to check, not a determination of non compliance. Every finding also states how many devices or licences the check could actually evaluate, so a check that found nothing and a check that could not run are never presented the same way. The reports cannot verify actual radiated power, EME exposure, earthing, labelling or physical access, and by construction they say nothing about unlicensed equipment.

What happens to a report I bought if the register changes?

A generated report is stored against your account together with a fingerprint of every register value it was computed from. When you reopen it, that fingerprint is compared against the register as it stands. If nothing has moved the stored report opens straight away, so a document already sent to a client does not change silently underneath them. If the site record has changed, the panel tells you and the refresh costs nothing.

Does the channel finder tell me a frequency is available?

No, and it deliberately never uses that word. It reports what the ACMA register contains on each channel and on the channels either side within a stated radius, and ranks candidate duplex pairs worst case first across both legs. Whether a channel can actually be licensed depends on the band plan, the service class, embargoes and a coordination calculation the register does not carry. The band and duplex split presets are measured from where assignments cluster in the register rather than assumed.

How is this different from the ACMA public website?

The ACMA public website provides authoritative search and download access to the register. The noIM₃ ACMA Database Map presents the same authoritative data on an interactive engineering surface optimised for the work RF engineers actually do. Spatial map view with clustering. Multi tab site detail panels. Cross site interference and P2P analysis. Coordinate based search. Spectrum band plan overlay. RF statistics aggregation. Portfolio management. The data is the same. The presentation and analysis tooling is what makes it usable for engineering rather than only for record retrieval.

Does my portfolio data stay private?

Yes. Portfolio claims and the associated metadata are scoped to your authenticated account. Claimed sites are not visible to other users and are not exported back into the public register. Useful for commercially sensitive licence portfolios where the customer relationship or the specific holdings are confidential.